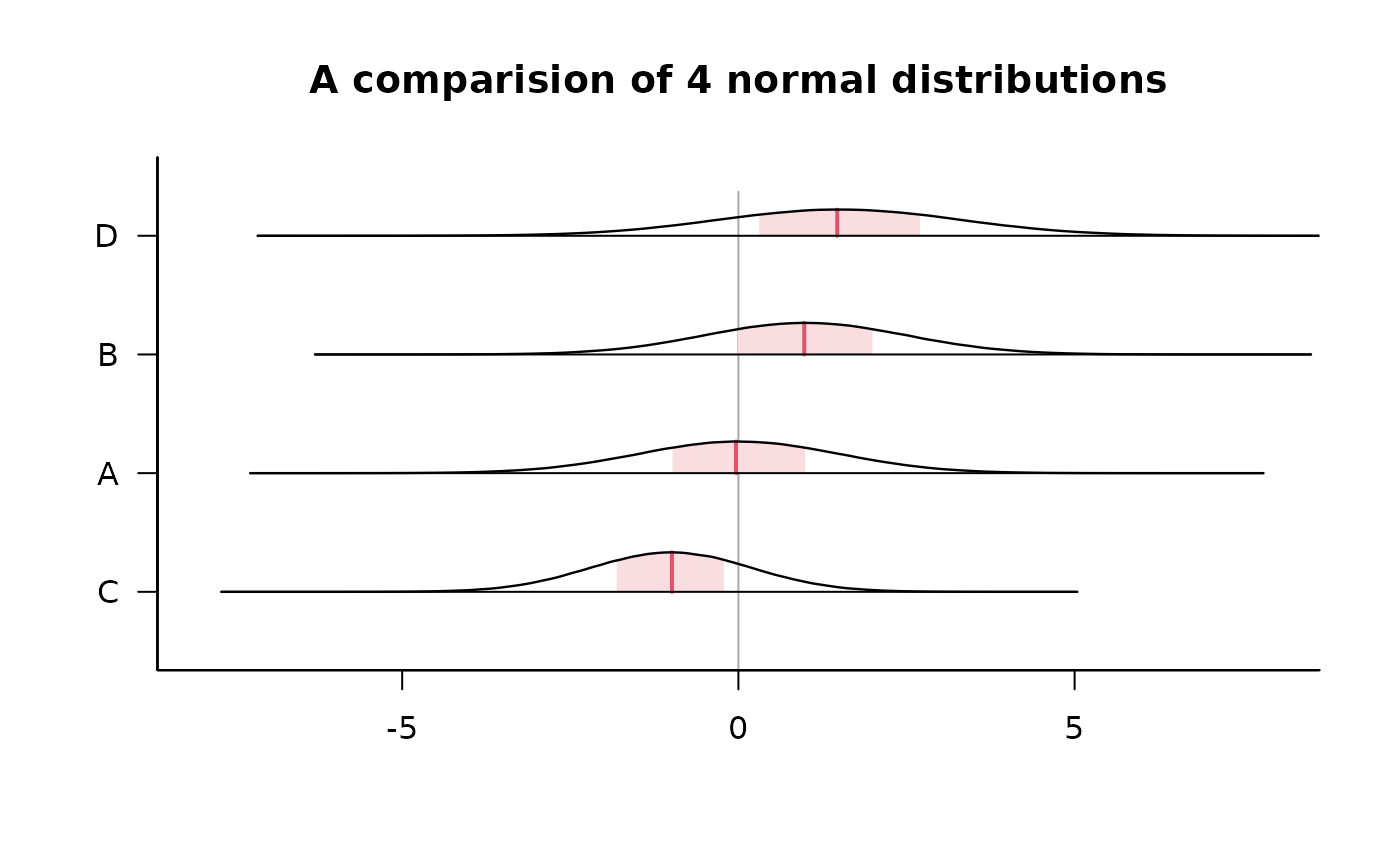
Forest plot for multiple densities
Usage
plot_forest(
  dat,
  labels,
  shade_inv = c(0.25, 0.75),
  center = c("mean", "median", "mode"),
  decreasing = FALSE,
  vert_ref = NULL,
  col = 2,
  xlim = NULL,
  ylim_base = 0,
  sep_fct = 0.5,
  adj = -0,
  dens_col = 1,
  shade_pad_white = T,
  shade_col = col.alpha(2, 0.2),
  center_col = 2,
  plot_center = TRUE,
  x_axis_at = NULL,
  ...
)
Arguments
- dat
A list of numeric vectors with each representing a set of observations from a distribution.
- labels
Character vector. Labels plotted on the y-axis.
- shade_inv
Numeric vector of length 2. The central area to be shaded in the distributions By default, the central 50% regions are shaded. Set
shade_invto NULL to disable the shading.- center
String. The statistic used for drawing the central tendency line. Defaults to
mean.- decreasing
Logical. Whether to decreasingly sort the distributions according to their central tendency measures. If NULL, the distributions will be arranged according to the order in which they are passed in.
- vert_ref
Numeric. The position of the vertical reference line. If NULL, nothing is plotted.
- col
Integer or String. A color code recognized by base R. Determines the color of the central tendency lines and shaded regions.
- xlim
Numeric. A vector of length 2 giving the plotted x range.
- sep_fct, adj, ylim_base
Parameters to tweak the positions of the distributions.
sep_fctchanges the distances between a pair of distributions.ylim_basedetermines the height of the density WITHIN a distribution.adjshifts the baselines of the distributions, with positive values shifting them upwards and negative values downwards.- plot_center
Logical. Whether to plot the central tendency line. Defaults to TRUE.
- ...
Additional arguments passed to the main
plot()function.